No products in the cart.
A dragonfly doji candlestick forms when a session’s open, close, and high prices all land at the same
level leaving only a long downward shadow behind. That T-shaped candle is not random noise
on your chart. It is a compressed record of a very specific battle between buyers and sellers, and
buyers won decisively.
Most traders see the shape and immediately call it bullish. That’s partially right — but as you’ll see
below, the context around it changes everything.
What is a Dragonfly Doji candlestick pattern?
The dragonfly doji candlestick pattern is a single-candle formation where price opens, gets driven
sharply lower by sellers during the session, and then gets completely reclaimed by buyers before the
close. The result is a candle with virtually no real body and a long lower shadow — shaped like the
letter T.
What sets it apart from other doji variations is the absence of any upper shadow. The entire
session’s price range sits below the open-close level, which is a very specific and meaningful
signature.
Anatomy of the dragonfly doji candle
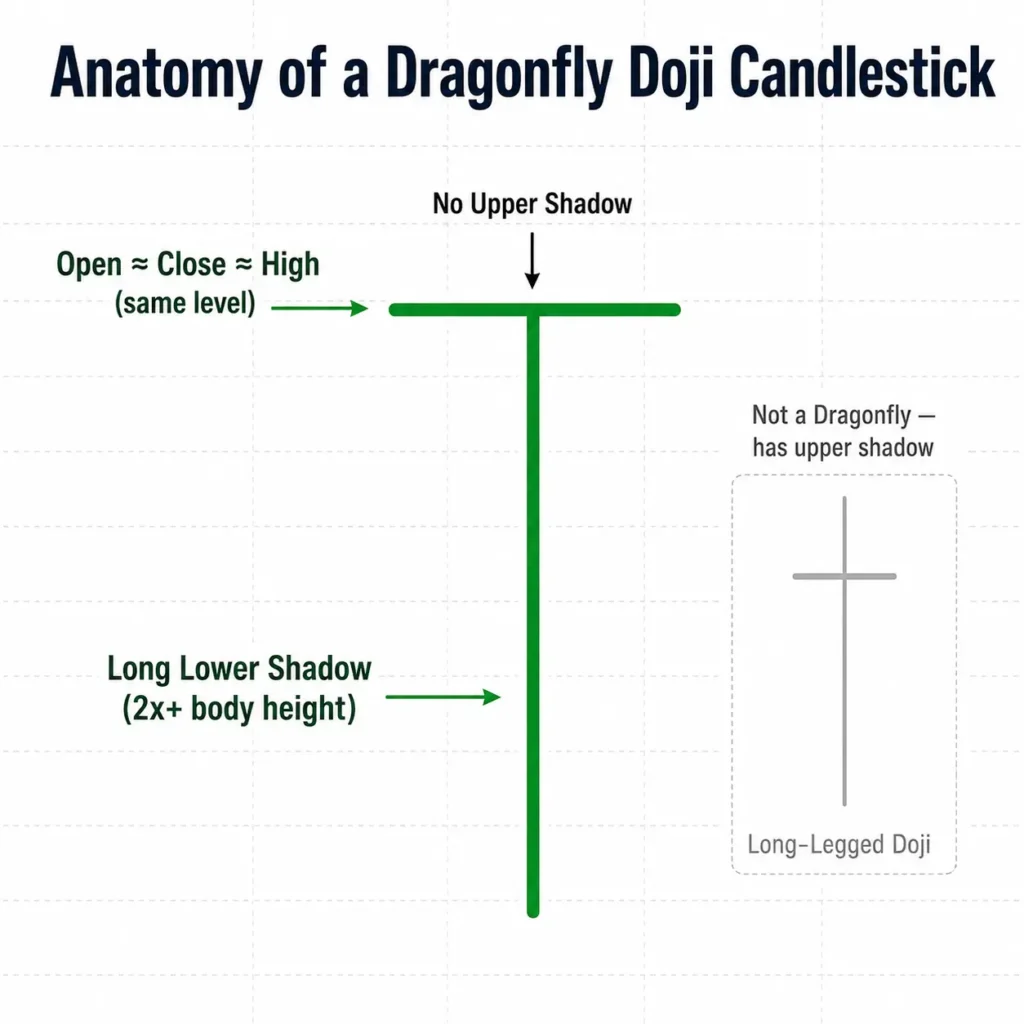
Three price conditions must align for this pattern to qualify:
- Open ≈ Close ≈ High — all three price points are at the same level (or within a few ticks)
- Long lower shadow — the shadow should be at least twice the size of an average candle
body - No upper shadow — even a short upper shadow changes the pattern’s identity
If a moderate upper shadow is present, you’re looking at a long-legged doji, not a dragonfly. That
distinction matters when you’re making trade decisions with real money.
If a moderate upper shadow is present, you’re looking at a long-legged doji, not a dragonfly. That
distinction matters when you’re making trade decisions with real money.
Where and when does it form?
The dragonfly doji pattern most commonly appears at the bottom of a sustained downtrend or at a
recognised support level. It shows up across any market — stocks, Nifty 50, forex pairs,
commodities, crypto and any timeframe.
That said, it carries far more weight on daily and weekly charts, where each candle reflects broader
market participation rather than intraday noise.
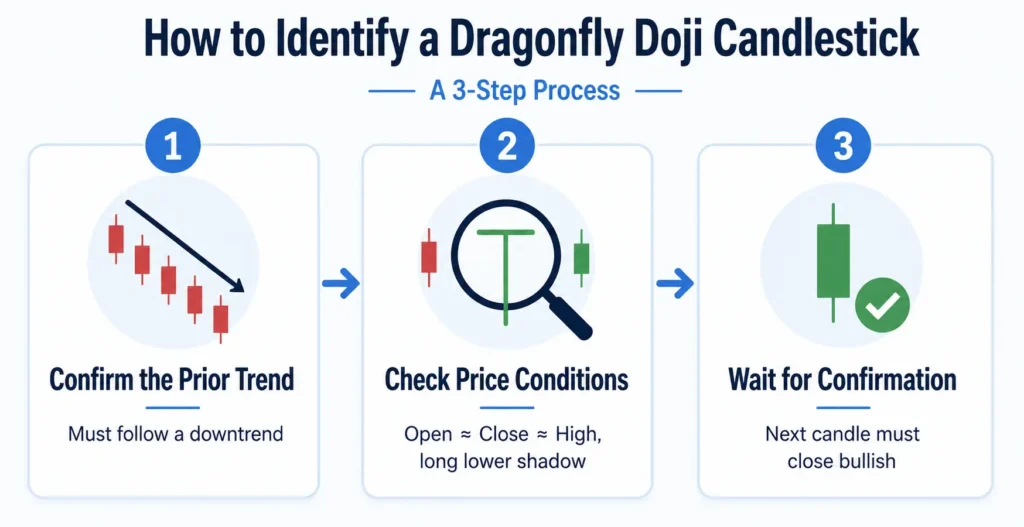
How to identify a Dragonfly Doji on a price chart?
Spotting the T-shape is straightforward. Validating it properly is where most traders take shortcuts
they later regret.
Step 1: Confirm the prior trend
A dragonfly doji earns its bullish reversal label only when it forms after a downtrend. Without a
preceding decline, there is nothing to reverse. This is the most commonly skipped step — and the
one that leads to the most misread signals.
The downtrend doesn’t need to be weeks long. A sharp multi-day pullback qualifies. What you need
is clear directional selling pressure visible before the candle appears.
Step 2: Check the three price conditions
Zoom in and verify the candle structure yourself. Open, high, and close should all land at the same
price level. The lower shadow should be meaningfully long — a shadow that barely clears the body
height doesn’t carry the same weight as one that is three or four times the body size.
Many charting platforms auto-label dragonfly doji candles, but automated scanners sometimes flag
near-misses. Eyeballing the actual candle on your chart takes ten seconds and saves bad trades.
Step 3: Wait for the confirmation candle
This is non-negotiable. A dragonfly doji candle on its own is a warning, not a green light. You need
the following candle to close bullish — ideally a strong green candle closing above the dragonfly’s
open/close level.
Volume matters here. A volume spike on the dragonfly session, followed by continued buying in
the next candle, makes the reversal story far more credible.
If you’d rather build this skill under proper guidance, enrolling in a technical analysis course in Jaipur can help you practice spotting these setups on live charts with real-time feedback from experienced mentors.
What does a Dragonfly Doji tell traders?
At its core, the dragonfly doji meaning comes down to a single idea: sellers tried hard and got
nowhere.
Buyer vs. seller psychology
During the session, sellers took control early and drove price significantly lower. Then buyers
stepped in. They absorbed every bit of that selling pressure and pushed price all the way back to the
opening level before the close.
That recovery is what the long lower shadow is recording. Bears tried to push through a level and
were completely rejected. That kind of price action at the right location on a chart is worth paying
attention to.
Bullish reversal vs. continuation signal
Here is the nuance that most articles skip over: a dragonfly doji in an uptrend has an entirely
different meaning.
A bullish dragonfly doji forms after a downtrend, at or near support — this is the classic setup. A
dragonfly appearing after sustained buying, near a resistance zone, instead hints at growing
indecision and possible reversal to the downside. A bearish dragonfly doji scenario is rarer but
real.
Shape alone tells you nothing. Position on the chart tells you everything.
Many traders sharpen this kind of chart-reading instinct by training at the best stock market training institute in Jaipur, where live market sessions help connect theory with real price action.
How to trade the Dragonfly Doji: entry, stop-loss, and target?
Trading the dragonfly doji candlestick pattern well means having a clear plan before you enter and not making it up in the moment.
Entry point
Wait for the confirmation candle to fully close. Once it closes bullish, enter at the open of the third
candle (the one after confirmation). Some experienced traders enter on the close of the confirmation
candle itself when they’re watching the chart live — that’s a valid approach too, but only after the
candle has actually closed.
Do not enter on the dragonfly itself. You’re still in uncertainty until confirmation is in.
Stop-loss placement.
Place your stop-loss just below the lowest point of the dragonfly’s lower shadow. That low is your
invalidation level — if price breaks below it, the reversal thesis is simply wrong.
Add a small buffer of a few points or pips below the shadow low to avoid getting stopped out by
stop-hunting, which is common in high-liquidity markets like Nifty, Bank Nifty, and major forex
pairs.
Profit target
The nearest overhead resistance level is your first logical profit target. If no clear resistance exists, a
1:2 risk-to-reward ratio works well as a default — your target is twice the distance from entry to
your stop.
For swing trades, consider taking partial profits at the first resistance zone and holding the rest
toward a higher target.
Combining with indicators
The dragonfly doji candlestick becomes significantly more reliable when other signals align:
- RSI below 30 — oversold reading confirms seller exhaustion
- Above-average volume on the dragonfly session — validates genuine buying pressure, not
a low-participation bounce - 50-day or 200-day moving average nearby — structural support adds conviction
- Bullish divergence on MACD — momentum shifting before price does.
You don’t need all four to tick. Two or three in alignment is enough to shift a moderate-probability
setup into a high-conviction one.
Dragonfly Doji vs. similar candlestick patterns
The dragonfly doji is easy to confuse with related patterns. Here’s how to tell them apart without
overthinking it.
Dragonfly Doji vs. Gravestone Doji
The gravestone doji is the exact mirror image of the dragonfly. It has a long upper shadow and no
lower shadow — price was driven up by buyers, then completely rejected back to the open by sellers. Where the dragonfly signals potential buying strength at the bottom, the gravestone signals selling strength at the top.
Think of it this way: dragonfly doji and gravestone doji are opposites. One is a potential floor
signal; the other is a potential ceiling signal.
Dragonfly Doji vs. Hammer
The hammer candlestick looks nearly identical to the dragonfly — long lower shadow, little to no
upper shadow. The key difference is structural: the hammer has a small real body (open and close
are not at the same price), while the dragonfly doji has virtually no body at all.
| Feature | Dragonfly Doji | Hammer |
| Real body | None (or near zero) | Small (green or red) |
| Lower shadow | Long | Long |
| Upper shadow | None | Minimal |
| Confirmation needed | Yes | Yes |
| Signal conviction | Moderate | Moderate–High |
In practice, the hammer is considered slightly more reliable because the bullish close above the
open adds an extra layer of conviction. The dragonfly doji compensates for that with the
confirmation candle requirement.
Limitations and key things to watch out for
The dragonfly doji candlestick pattern is genuinely useful but treating it as a guaranteed signal is
a fast way to lose money.
- It’s a rare pattern. A true dragonfly, where open, high, and close are all exactly equal, does not appear frequently. If you find yourself forcing the label onto candles that almost qualify, you’re manufacturing signals that aren’t there.
- It produces false signals in thin markets. Low-liquidity stocks and minor currency pairs can generate dragonfly-shaped candles simply from poor order flow, not from real buying pressure. Always cross-reference with volume.
- Confirmation is not optional. Acting on the dragonfly alone — without a confirming candle — is one of the most consistent and costly mistakes in candlestick trading. The extra candle costs you a few pips of entry price. A false reversal costs you a lot more.
- It’s context-dependent, not standalone. The same shape means different things depending on trend direction and location on the chart. Reading it in isolation, without trend context, is a common beginner mistake.
Final thoughts
The dragonfly doji candlestick rewards patience more than any other single-candle pattern. It asks you to wait for the right trend context, the right location on the chart, and the right confirmation before committing — and when all three align, it is one of the cleaner reversal signals in technical analysis.
Use it with discipline, layer in volume and one or two momentum indicators, and you’ll find it earns its place in your trading toolkit. For the full picture, read our guides on the Gravestone Doji, Hammer candlestick, and the complete family of Doji patterns.
Disclaimer: This content is for educational purposes only and does not constitute financial advice. Always do your own research before making any trading decisions.
Also Read: Why Most Retail Traders in India Lose Money — And What Actually Fixes It
Frequently Asked Questions
Yes and when it does, it changes what the pattern means. In an uptrend, a dragonfly doji suggests that buying momentum is starting to stall. Sellers made a run during the session, and while buyers recovered the close, the pattern hints at growing indecision. If the next candle closes bearish and you’re near a resistance zone, that is worth taking seriously.
On its own, the dragonfly doji has moderate reliability — successful reversal rates sit roughly in the 55–65% range under ideal conditions. That number improves significantly when you layer in RSI, volume confirmation, and proximity to a key support level. Without any confirmation, the signal is not much better than chance.
The dragonfly doji is primarily a bullish reversal signal, but only when it forms at the bottom of a downtrend and is followed by a confirming bullish candle. When it appears in an uptrend or near resistance, it can signal a bearish pause or reversal instead. The shape is the same; the meaning changes based entirely on where it sits in the trend.
A standard doji has both an upper and lower shadow, with open and close meeting somewhere in the middle of the candle. The dragonfly doji specifically has no upper shadow — only a long lower shadow. That structural difference is what gives it directional bias. A standard doji signals pure indecision; the dragonfly signals that sellers tried and failed completely.