No products in the cart.
Quick answer: Jaipur’s most-searched stock market institutes are QIFM, NIWS, GTF, Nandi Academy, and JamaDhan Stock Market Institute. Each specializes differently — …

Quick answer: Jaipur’s most-searched stock market institutes are QIFM, NIWS, GTF, Nandi Academy, and JamaDhan Stock Market Institute. Each specializes differently — …

Disclaimer: This article is for informational purposes only and does not constitute investment advice. IPO investments carry market risk. Please consult a …

Jio Platforms Ltd. filed its Draft Red Herring Prospectus (DRHP) with SEBI on June 19, 2026, for a fresh issue of 27 …
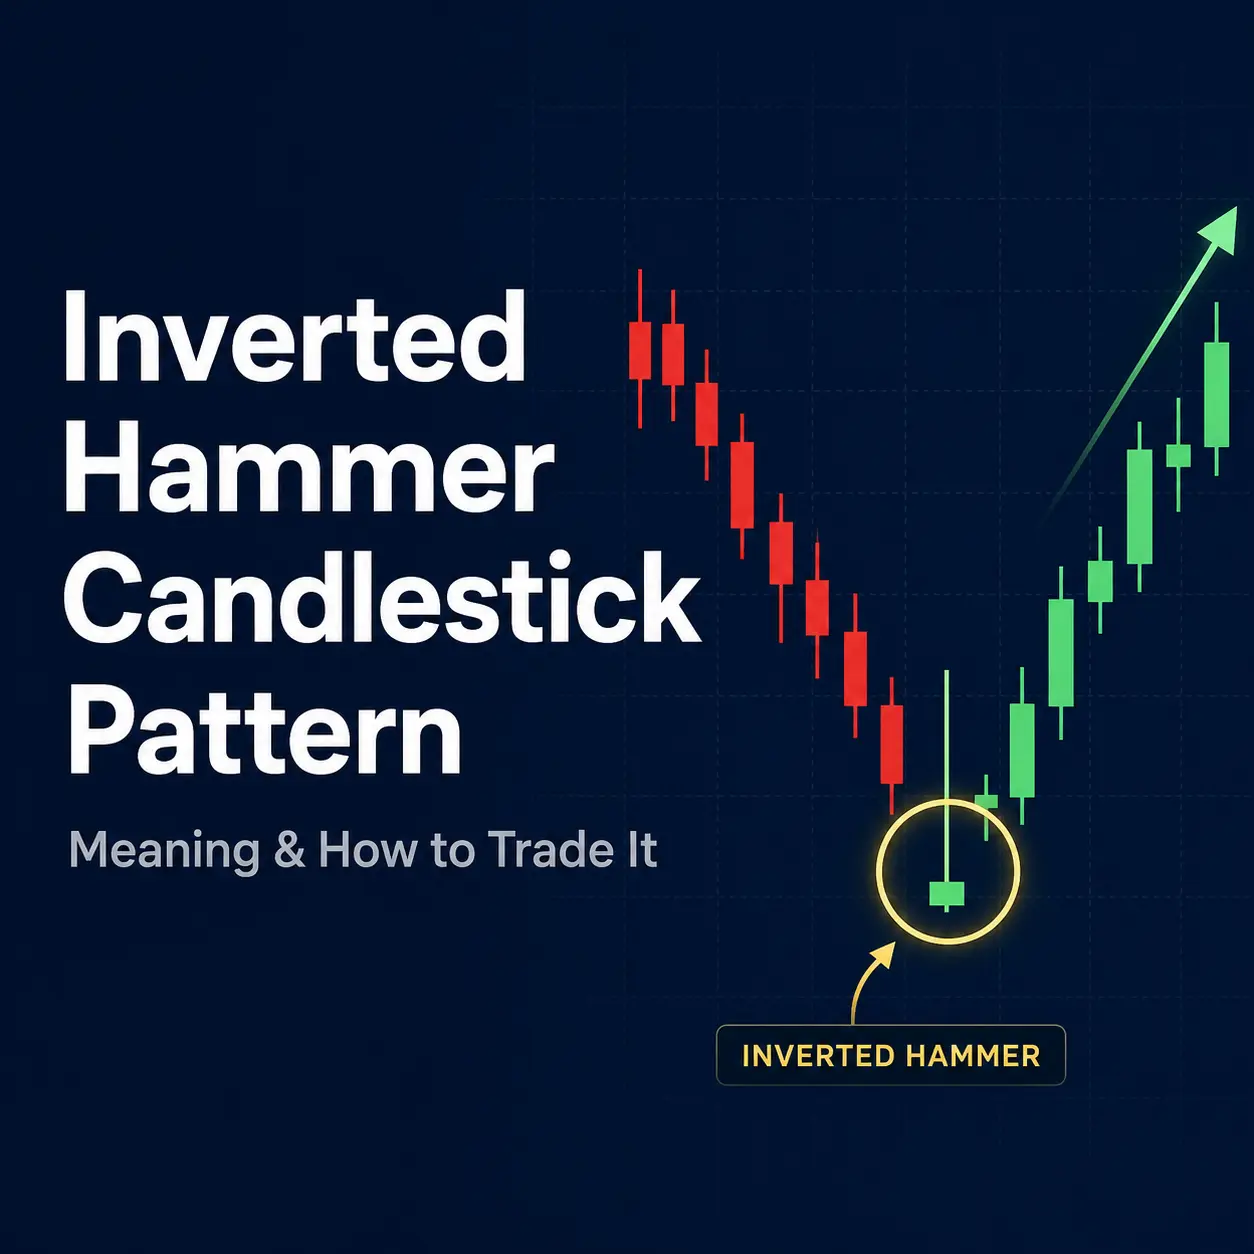
If you’ve spotted a candle with a tiny body and a long wick sticking up like an antenna, you’ve probably run into …

Break-even analysis is the financial calculation every business owner needs before making a pricing, hiring, or investment decision. This guide covers the …
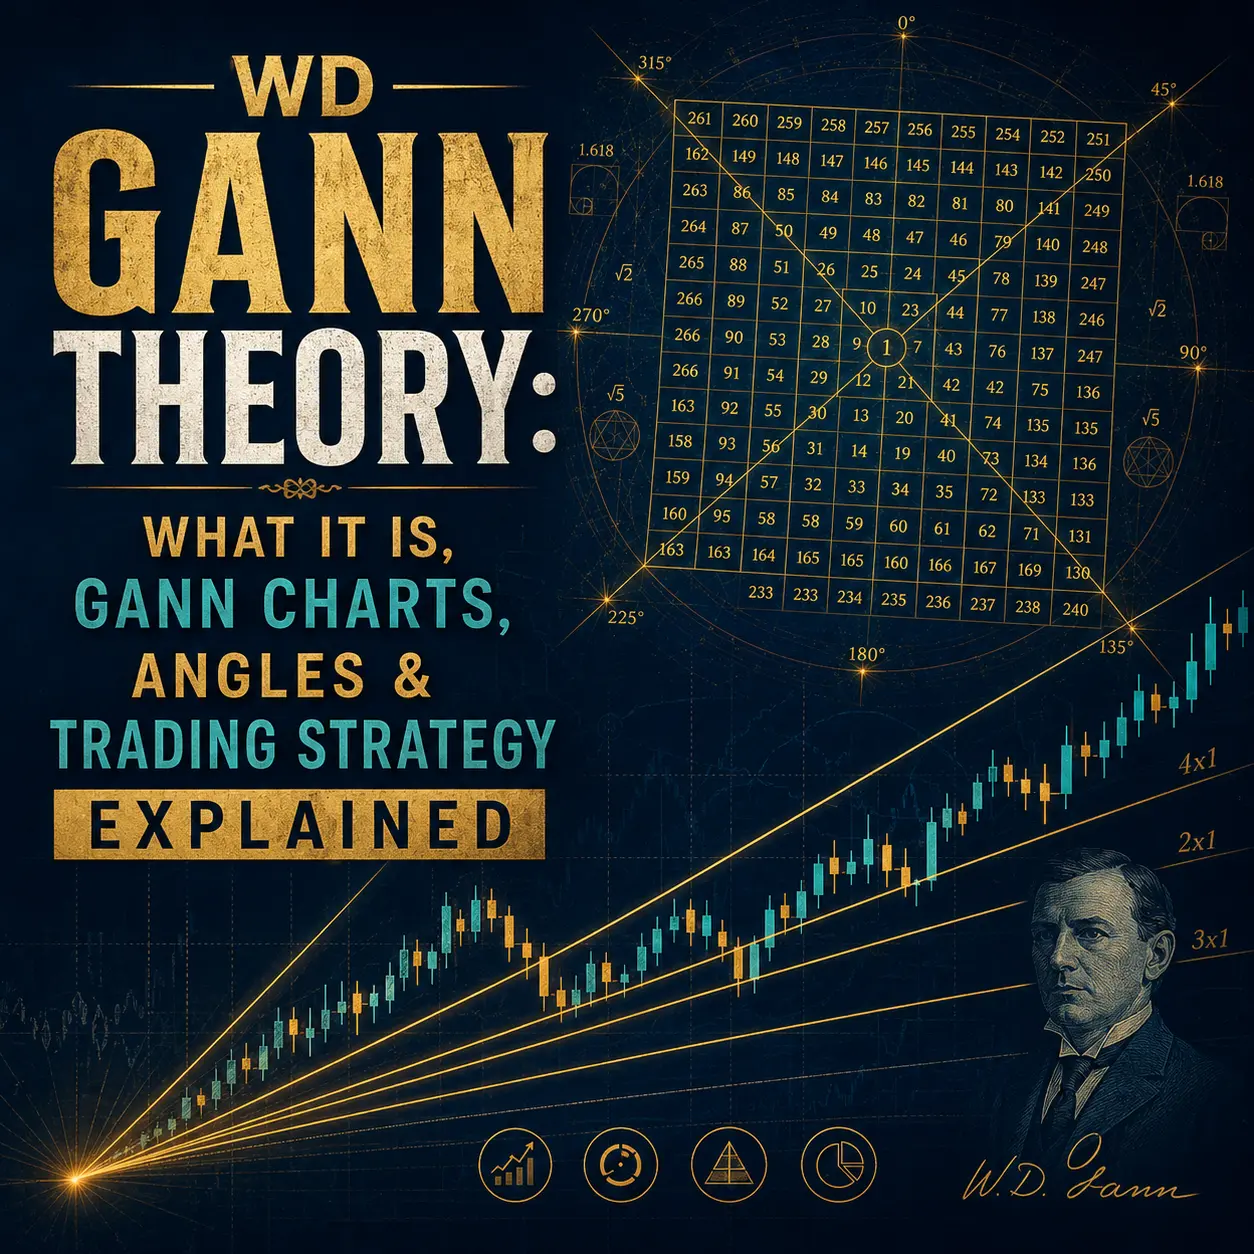
Quick answer: Gann Theory is a trading framework developed by William Delbert Gann that uses price, time, and geometry to forecast market …
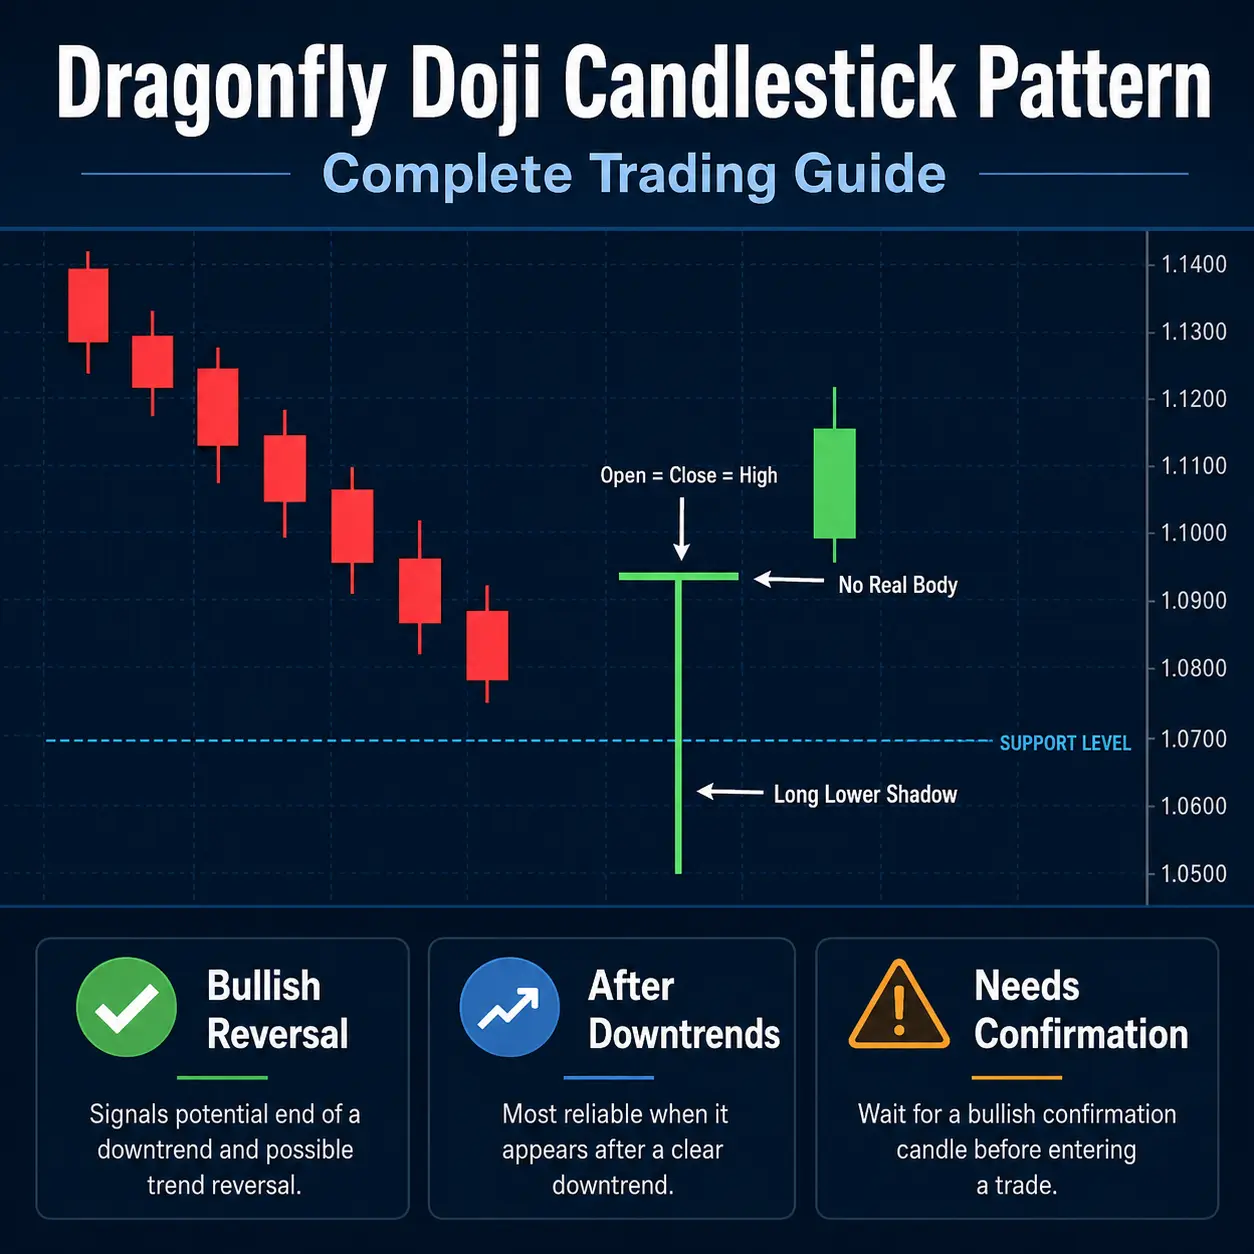
A dragonfly doji candlestick forms when a session’s open, close, and high prices all land at the samelevel leaving only a long …
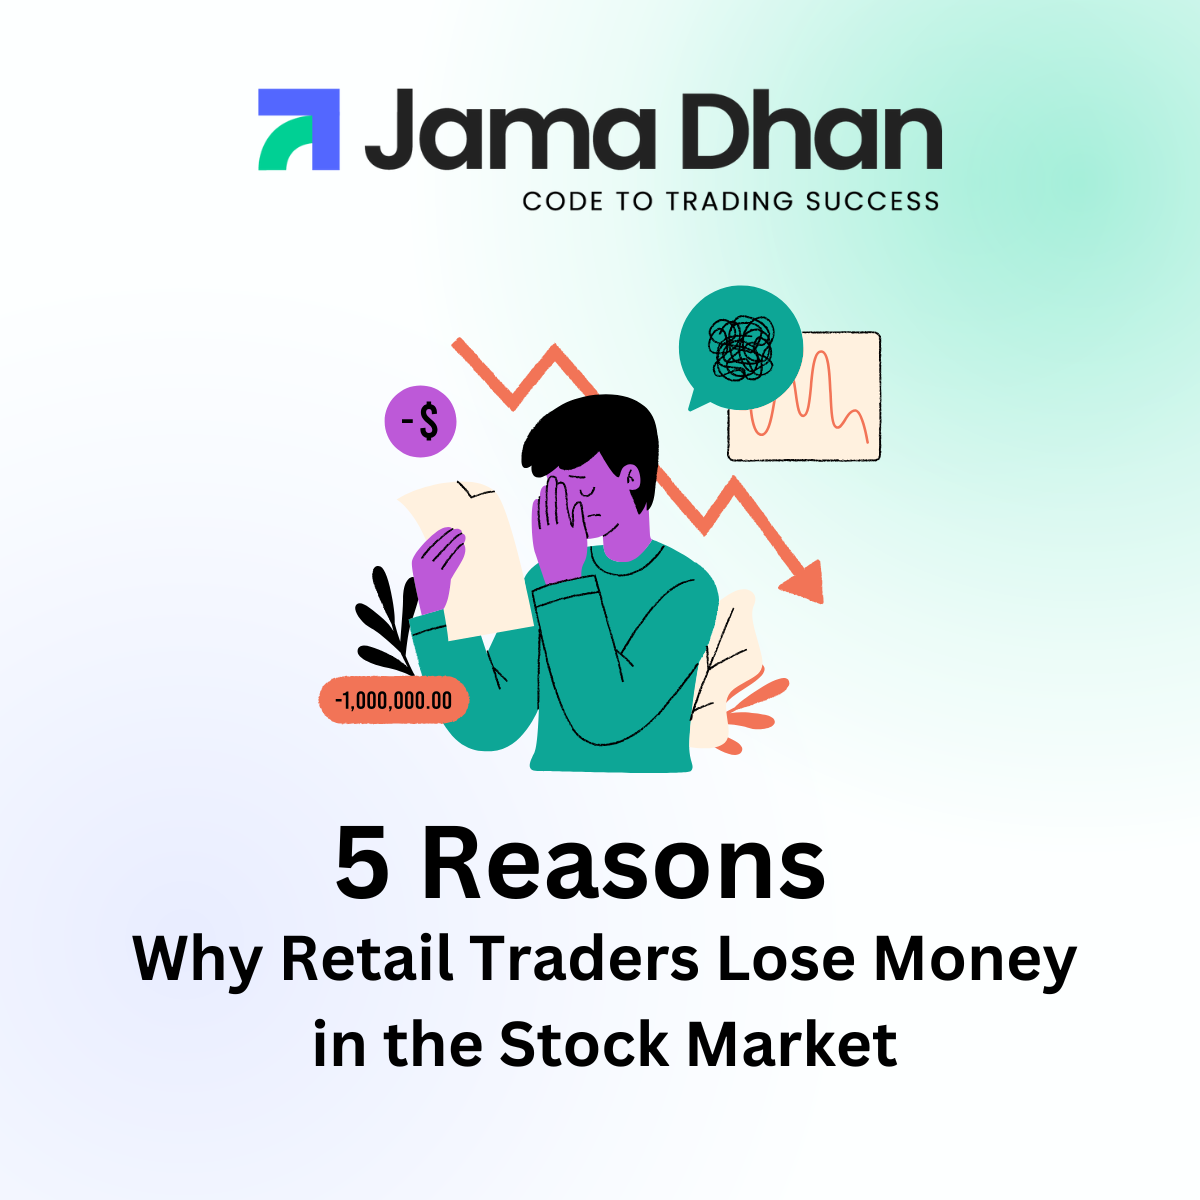
Most retail traders in India don’t lose money because the market is hard. They lose because they enter positions without a framework …
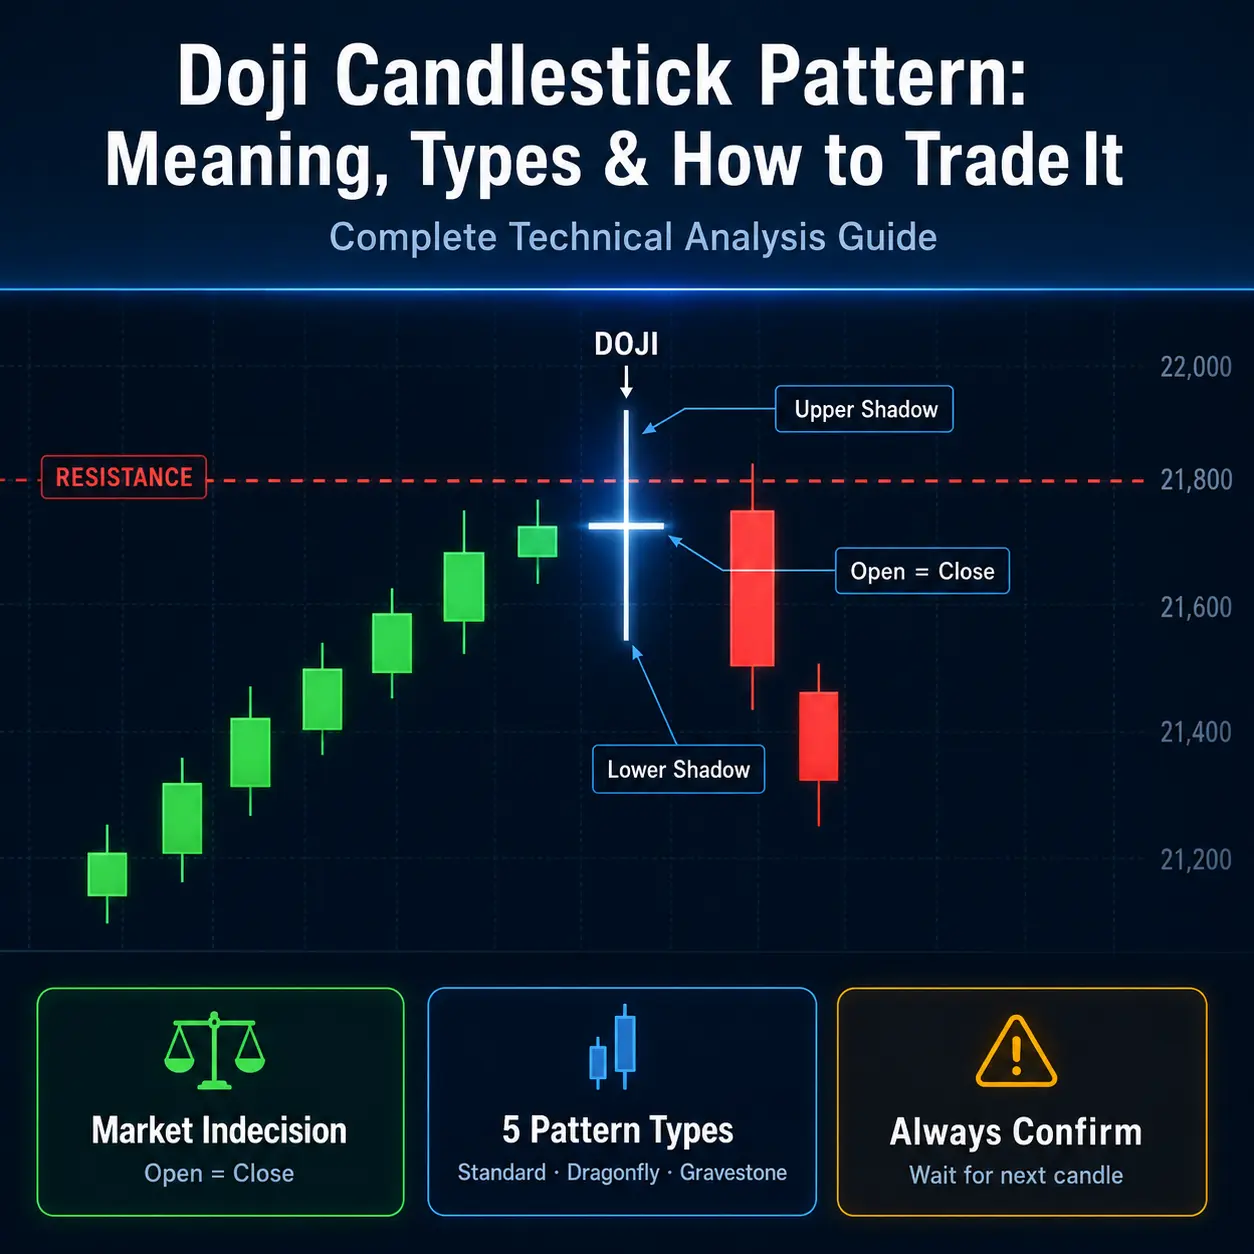
Quick Definition A doji candlestick pattern forms when a security’s opening and closing prices are nearly identical leaving a tiny or nonexistent real body …