
No products in the cart.

If you’ve spent any time looking at stock charts on NSE or BSE, you’ve probably seen it without knowing what it was called: a sharp, fast move in price, followed by a tight little pause that looks almost like a flag fluttering on a pole. That’s a flag pattern, and it’s one of the most reliable continuation setups a trader can learn to spot.
This guide covers everything you need to know: what a flag pattern is, how to tell a bull flag from a bear flag, how it’s different from the flag and pole pattern and the inverted flag pattern (two terms that confuse a lot of traders), and exactly how to trade one with proper entry, stop-loss, and target levels.
What Is a Flag Pattern?
A flag pattern is a continuation pattern. That means it doesn’t signal a reversal — it signals a pause. The stock was moving strongly in one direction, takes a breather, and then (usually) continues in the same direction it was already going.
It has three parts, and understanding each one is the difference between spotting a real flag and mistaking some random sideways movement for one.
The Flagpole (Momentum Phase)
The flagpole is the sharp, fast price move that kicks the whole pattern off — either a steep rally or a steep decline. This move usually comes with a noticeable jump in volume, which tells you buyers (or sellers) are aggressive and confident, not just drifting.
A steeper, more decisive flagpole makes the whole pattern more trustworthy. A weak, choppy move up or down doesn’t really count as a flagpole, and any “flag” that follows it is less reliable.
The Flag (Consolidation Phase)
After the flagpole, price pauses. This is the flag itself — a tight channel, usually sloping slightly against the direction of the flagpole, bordered by two roughly parallel lines.
Two rules matter here:
- The pullback shouldn’t retrace more than about half the height of the flagpole. If it does, the pattern starts looking less like a pause and more like a genuine reversal.
- It shouldn’t drag on too long. A flag that consolidates for weeks starts to lose its identity as a “pause” and starts looking like something else entirely — a range, or a reversal setup.
Volume usually drops during this phase. That’s a good sign — it tells you the pullback is profit-taking, not a change of heart from the broader market.
The Breakout (Confirmation)
The pattern completes when price breaks out of the flag’s channel, back in the direction of the original flagpole. For this breakout to be trustworthy, you want to see volume pick back up. A breakout on weak volume is far more likely to fail or fake out.
Bull Flag vs Bear Flag: Key Differences
| Feature | Bull Flag | Bear Flag |
|---|---|---|
| Preceding trend | Sharp move up | Sharp move down |
| Flag slope | Slightly down or flat | Slightly up or flat |
| What’s happening psychologically | Profit-taking after a rally | Short-covering or bargain-hunting after a drop |
| Volume during the flag | Drops off | Often holds steady or rises |
| Breakout direction | Upward, continuing the rally | Downward, continuing the decline |
A bull flag forms during an uptrend and typically resolves higher. A bear flag forms during a downtrend and typically resolves lower. Same structure, opposite direction, opposite psychology.
Flag and Pole Pattern: A Closer Look
You’ll often see “flag and pole pattern” used as if it’s a separate pattern from a regular flag — it isn’t. It’s the same pattern, just named with more emphasis on the pole (the flagpole) as the defining feature. Some traders use this name specifically when the pole is unusually steep or long relative to the flag, which tends to make the eventual breakout more powerful.
[This section will link to our full Flag and Pole Pattern guide once published — covering the pole formation in depth, including how to measure pole height for your profit target.]
Inverted Flag Pattern: Is It the Same as a Bear Flag?
Short answer: yes, mostly. “Inverted flag pattern” is an alternate name some traders and educators use for what is essentially a bear flag — a sharp decline (the pole) followed by a brief upward-sloping consolidation (the flag), followed by a continuation lower.
The naming gets used inconsistently across the internet, which causes real confusion. Here’s a simple way to keep it straight:
| Term | What it usually means |
|---|---|
| Bear Flag | Standard name for a bearish continuation flag |
| Inverted Flag | Same structure as a bear flag — used interchangeably by many sources |
| Inverted Flag vs Double Top | A double top is a reversal pattern (two failed highs); an inverted/bear flag is a continuation pattern within an existing downtrend. Don’t confuse the two just because both are bearish. |
Flag vs Pennant vs Wedge: How to Tell Them Apart
This is where a lot of traders get tripped up, because all three patterns involve a sharp move followed by consolidation. The difference is in the shape of the consolidation.
| Feature | Flag | Pennant | Wedge |
|---|---|---|---|
| Consolidation shape | Rectangle — two roughly parallel lines | Small symmetrical triangle | Converging, sloped channel |
| Trendlines | Parallel | Converging to a point | Converging, both sloping the same direction |
| What it signals | A pause before continuation | Indecision before continuation | Weakening momentum — can precede reversal or continuation |
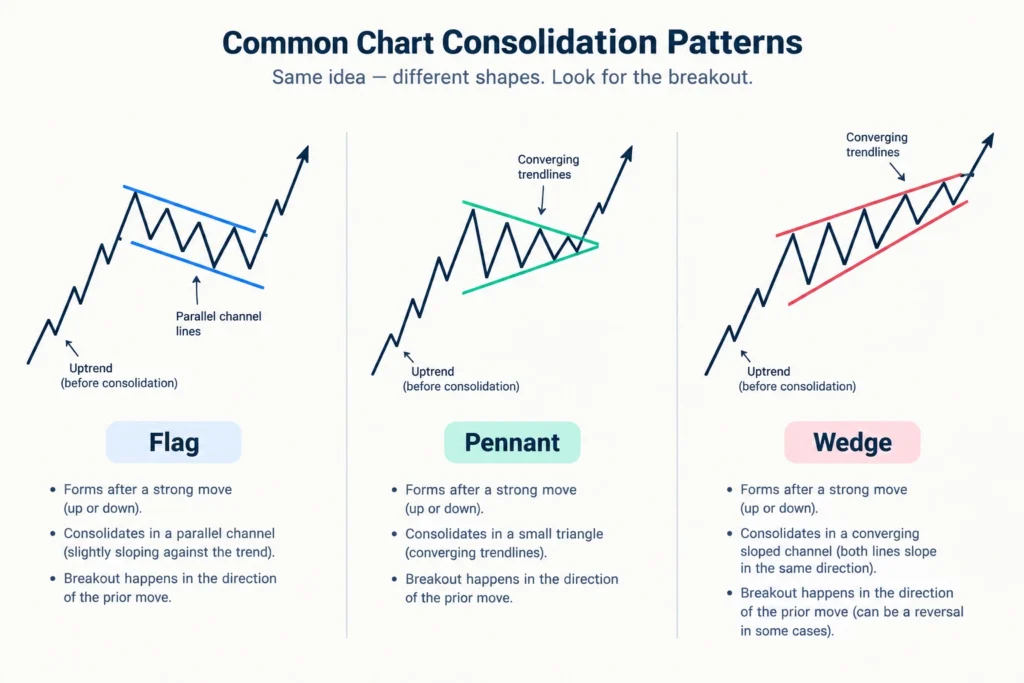
Roughly parallel boundary lines mean you’re looking at a flag. Lines converging into a point signal a pennant instead. And when the lines converge while both sloping in the same direction, that’s a wedge — which deserves more caution, since it can resolve either way.
How to Trade a Flag Pattern
Entry Rules
The most common entry is on the breakout itself — buying (or shorting, for a bear flag) once price closes clearly outside the flag’s channel, ideally with a visible pickup in volume.
A more conservative approach is to wait for a retest: let price break out, then come back and test the old boundary line (which now acts as support for a bull flag, or resistance for a bear flag) before entering. This costs you some of the move but gives you a tighter, more defined risk level.
Stop-Loss Placement
For a bull flag, place your stop just below the lower boundary of the flag. For a bear flag, place it just above the upper boundary. The idea is simple: if price re-enters the flag’s channel after supposedly breaking out, the pattern has likely failed.
Profit Target (Flagpole Projection Method)
Measure the height of the flagpole — the full move from where it started to where the consolidation began. Then project that same distance from the breakout point, in the direction of the breakout. That gives you your target.
Some traders take the full projected distance. Others take a partial target (say, 50–75% of it) and treat the rest as a bonus, since markets don’t always deliver the full textbook move.
Common Mistakes Traders Make with Flag Patterns
If you’ve spent any time looking at stock charts on NSE or BSE, you’ve probably seen it without knowing what it was called: a sharp, fast move in price, followed by a tight little pause that looks almost like a flag fluttering on a pole. That’s a flag pattern, and it’s one of the most reliable continuation setups a trader can learn to spot.
This guide covers everything you need to know: what a flag pattern is, how to tell a bull flag from a bear flag, how it’s different from the flag and pole pattern and the inverted flag pattern (two terms that confuse a lot of traders), and exactly how to trade one with proper entry, stop-loss, and target levels.
Frequently Answered Questions
It can be either. A bull flag (forming during an uptrend) is bullish and typically resolves higher. A bear flag (forming during a downtrend) is bearish and typically resolves lower. The pattern itself is neutral — its direction depends on the trend it forms within.
There’s no fixed rule, but flags are meant to be short-term pauses. On daily charts, a flag lasting more than a few weeks starts to lose reliability as a “flag” and may be turning into something else.
Largely yes — most traders and educators use the two terms interchangeably to describe the same bearish continuation structure.
Flag patterns are considered one of the more reliable continuation patterns, but no chart pattern works in isolation. Confirming with volume, the broader trend, and (where relevant) other indicators improves the odds meaningfully over trading the pattern alone.