No products in the cart.
If you’ve spotted a candle with a tiny body and a long wick sticking up like an antenna, you’ve probably run into an inverted hammer candlestick.
It’s one of those patterns that looks confusing at first. But once you know what to look for, it’s genuinely easy to spot on any chart.
In this guide, we’ll break down what the inverted hammer pattern means, how it forms, and how traders actually use it — without the jargon overload.
Whether you’re new to candlestick charts or just brushing up before your next trade, this one’s worth understanding properly.
What Is an Inverted Hammer Candlestick Pattern?
An inverted hammer candlestick is a single-candle pattern that shows up after a downtrend. It has a small real body sitting near the bottom, with a long upper wick and almost no lower wick.
Think of it as an upside-down version of the regular hammer. The shape alone gives away a lot about what happened during that session — for a deeper primer on how candles are built, Wikipedia’s overview of candlestick charts is a solid reference.
This inverted hammer candlestick pattern usually hints at a possible bullish reversal. But — and this matters — it needs confirmation before you trust it fully. We’ll get to that.
You’ll find this pattern across stocks, forex, and crypto charts alike. It doesn’t discriminate by market — the psychology behind it stays the same everywhere.
How to Identify an Inverted Hammer Candle
Spotting an inverted hammer formation isn’t hard once you know the three things to check. Here’s what to look for:
1. Small real body near the low The open and close prices are close together, and both sit near the bottom of the candle’s range.
2. Long upper wick The upper shadow should be at least twice the size of the body. This is the most obvious giveaway.
3. Little to no lower wick There’s barely any shadow below the body. If there is, it’s usually very thin.
If a candle checks all three boxes, you’re likely looking at a genuine inverted hammer pattern, not just a random wick.
It also helps to glance at the candle before it. A prior downtrend gives the pattern actual meaning instead of just a shape you noticed.
Is the Inverted Hammer Bullish or Bearish?
Here’s the short answer: an inverted hammer candlestick is considered a bullish reversal signal, but only when it appears after a clear downtrend.
Context is everything with this pattern. The same shape can mean something completely different depending on where it shows up on the chart.
So before labeling anything an inverted hammer candlestick, always zoom out and check what price was doing in the days leading up to it.
Green vs Red Inverted Hammer
A green (bullish-colored) inverted hammer is generally seen as a slightly stronger signal. The close is above the open, which shows buyers gained a bit of ground by the end of the session.
A red inverted hammer isn’t necessarily bad news either. Sellers held the close below the open, but buyers still pushed price up significantly during the session — that tells its own story.
What If It Appears in an Uptrend?
If this same candle shape shows up during an uptrend instead of a downtrend, it’s no longer called an inverted hammer. It becomes a shooting star, and the implication flips toward a bearish signal.
That’s why location on the chart matters just as much as the shape itself.
What Does the Pattern Actually Tell You?
Every candle tells a small story about the fight between buyers and sellers. The inverted hammer candlestick formation tells a fairly dramatic one.
Price opens, then buyers step in hard and push it up during the session. But sellers regroup and drag the price back down near the open by the close.
The result? A long wick that shows real buying interest even though it didn’t fully “win” that candle. That’s often an early clue that momentum is shifting.
Think of it as sellers running out of steam. They’re still in control by the close, but they had to fight harder than before to keep price down.
That shift in effort is exactly what traders are trying to catch early, before the actual reversal shows up in price.
Real Chart Example
Let’s say a stock has been sliding for a week, trading around ₹480. On one particular day, it opens at ₹478, spikes up to ₹495 during the session, then drifts back down to close at ₹480.
That candle has a small body and a long upper wick — a textbook inverted hammer candlestick pattern.
On its own, this doesn’t confirm anything yet. But if the next day’s candle closes above ₹495, that’s the confirmation traders wait for before treating it as a genuine reversal signal.
Notice how the story plays out in just two candles. The first shows hesitation from sellers, and the second confirms buyers have actually taken over.
That two-step read is really the whole game with this pattern — spot the shape, then wait for the market to agree with you.
How to Trade the Inverted Hammer Candlestick Pattern
Trading this pattern isn’t about jumping in the moment you spot the shape. It’s a three-step process.
Step 1: Wait for Confirmation
Don’t enter on the inverted hammer candle itself. Wait for the next candle to close above the high of the hammer’s upper wick.
Step 2: Set Your Stop-Loss
Place your stop-loss just below the low of the inverted hammer candlestick. This protects you if the reversal fails to hold.
Step 3: Plan Your Target
A common approach is aiming for a risk-to-reward ratio of at least 1:2. Alternatively, target the next visible resistance level on the chart.
Patience at the confirmation stage is really what separates a good trade from a guessing game here.
Skipping any one of these three steps is usually where trades using this pattern go wrong. It’s a simple process, but it only works when followed in order.
How Reliable Is the Inverted Hammer Pattern?
Like most single-candle patterns, the inverted hammer candlestick isn’t a guaranteed signal on its own. It works best as a heads-up, not a standalone trade trigger.
Traders generally find it more dependable on daily or weekly charts compared to short intraday timeframes, where noise can create false signals.
Pairing it with support levels, volume spikes, or other indicators like RSI tends to improve its accuracy quite a bit. Confirmation is really the non-negotiable part.
A single inverted hammer candlestick appearing near a known support zone tends to carry more weight than one appearing in the middle of nowhere on the chart.
That’s the difference between trading the pattern blindly and trading it with actual context behind it.
Inverted Hammer vs Shooting Star vs Regular Hammer
These three patterns look similar or share names, which causes a lot of mix-ups. Here’s a quick side-by-side:
| Pattern | Shape | Appears After | Signal |
|---|---|---|---|
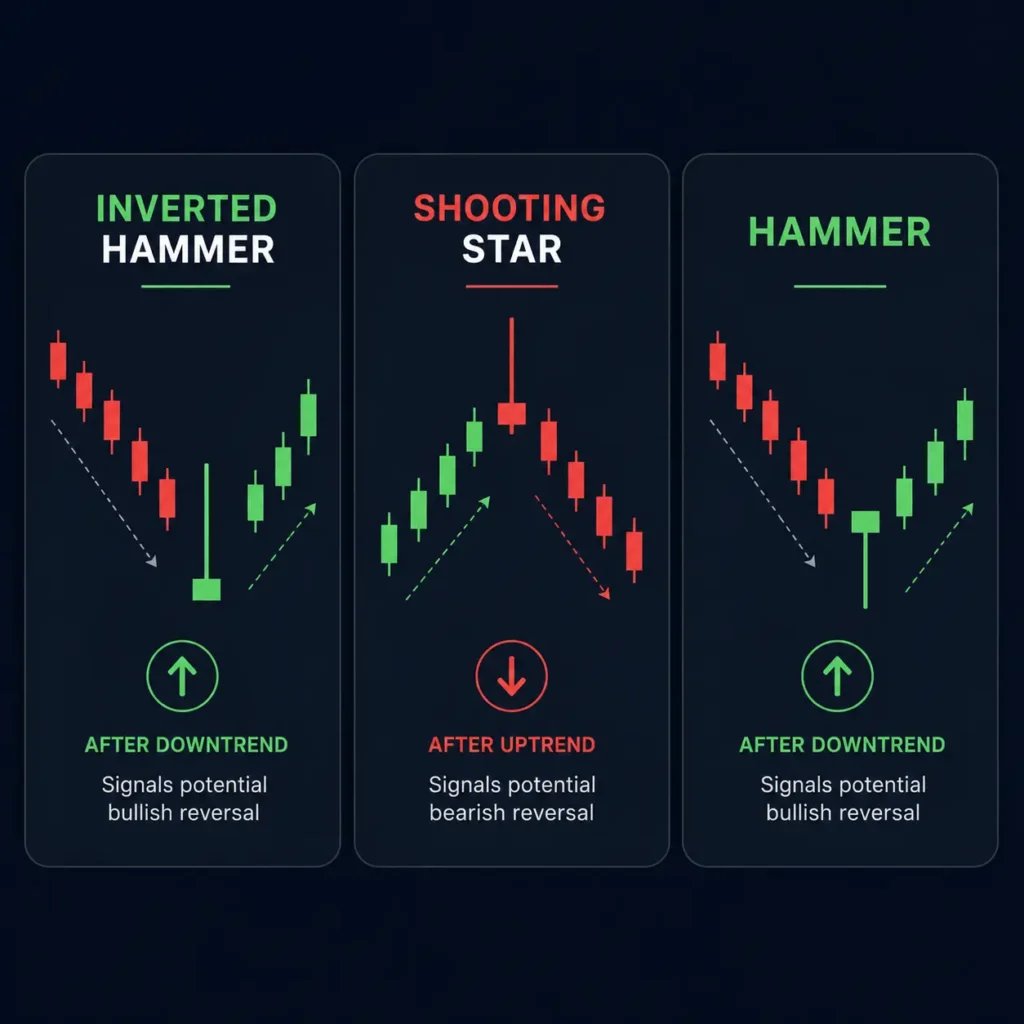
| Inverted Hammer | Small body, long upper wick | Downtrend | Bullish reversal |
| Shooting Star | Small body, long upper wick | Uptrend | Bearish reversal |
| Regular Hammer | Small body, long lower wick | Downtrend | Bullish reversal |
Same wick, different story — that’s the entire trick to remembering these three.
Common Mistakes to Avoid
A few slip-ups tend to trip up newer traders when using this pattern. Most of these come down to impatience or skipping a step.
Watch out for these:
- Trading without confirmation — jumping in immediately, before the next candle confirms anything
- Ignoring the trend context — mistaking a shooting star for an inverted hammer, or vice versa
- Skipping volume checks — a low-volume inverted hammer candle carries far less weight
- Overleveraging the trade — treating it as a sure thing rather than one signal among many
- Using it in choppy, sideways markets — the pattern loses most of its meaning without a real trend
Avoiding these alone puts you ahead of a lot of traders who trade this pattern purely on shape.
Final Thoughts
The inverted hammer candlestick pattern is a small but useful clue in reading market sentiment. It shows buyers testing the waters even during a downtrend.
Just remember — shape alone isn’t enough. Confirmation, trend context, and a bit of patience are what actually make this pattern worth trading.
Once you start spotting this inverted hammer formation consistently on real charts, it stops feeling like a textbook definition and starts feeling like a genuinely useful read on price action.
Disclaimer: This article is for educational purposes only and does not constitute financial or investment advice. Trading involves risk, and past chart patterns don’t guarantee future results. Always do your own research or consult a licensed financial advisor before making trading decisions.
Also Read: Break-Even Analysis: Formula, Examples & How to Use It for Smarter Business Decisions
Frequently Asked Questions
It’s bullish, but only when it forms after a downtrend. In an uptrend, the same shape is called a shooting star and turns bearish.
Yes. Always wait for the next candle to close above the hammer’s high before entering.
Both look identical. The difference is trend context — inverted hammer forms after a downtrend, shooting star forms after an uptrend.
Daily and weekly charts tend to give more reliable inverted hammer candlestick formations than short intraday timeframes.
Yes. If the next candle doesn’t confirm the move, the signal is considered invalid and should be skipped.