
No products in the cart.

A shooting star candlestick pattern is a bearish reversal signal that appears after an uptrend. It has a small real body near the bottom, a long upper wick, and little or no lower wick. Traders use it as a warning that buyers failed to hold higher prices, but they should wait for the next candle to confirm the reversal.
If you’ve spent any time looking at stock charts, you’ve probably noticed that prices don’t move in straight lines. They spike, they crash, they bounce and sometimes they leave behind clues about what’s coming next. One of the clearest clues traders watch for is the shooting star candlestick pattern, a single-candle signal that often appears right before prices reverse downward.
But here’s the thing: most traders spot the pattern and immediately sell, thinking they’ve found a golden opportunity. Then the trade fails, their stop-loss gets hit, and they’re frustrated. The difference between profitable traders and losing ones usually comes down to one simple rule: waiting for confirmation.
What Is a Shooting Star Candlestick Pattern?
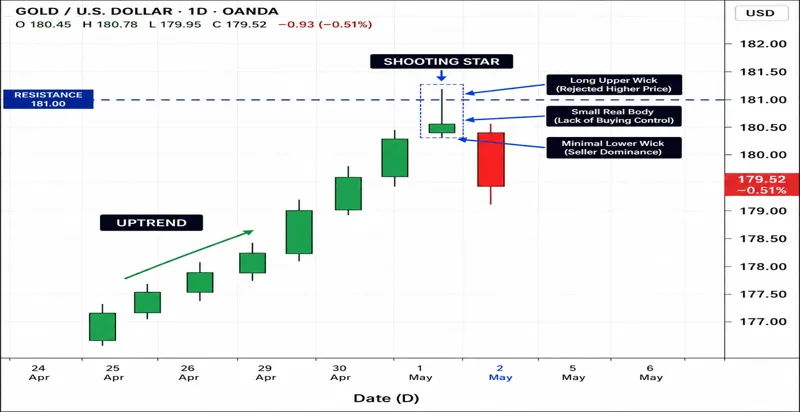
A shooting star is a bearish reversal candlestick pattern with a distinctive shape. It has a small real body (the filled or hollow box on the chart) positioned near the bottom, paired with a long upper wick or shadow that extends well above the body typically at least twice as long.
Visually, it resembles a star “shooting” downward. The upper wick represents buyers pushing price higher during the session, but sellers stepped in and forced it back down before close, leaving that extended tail behind.
Here’s the significance: this pattern shows rejection at higher prices. Buyers got excited and pushed the stock up, but couldn’t hold their gains. By close, prices were back near opening levels. That’s a warning signal that bullish momentum might be weakening.
How to Identify a Shooting Star Pattern?
Before trading any shooting star candlestick pattern, check for these five criteria:
First, confirm an uptrend exists.
The pattern only works after prices have risen for at least 3-5 candles. In sideways or downward markets, this pattern produces false signals.
Second, the body must be small.
Positioned at the lower end, showing sellers dominated despite earlier buying. Green or red bodies both qualify.
Third, the upper wick should be prominent.
At least 2-3 times longer than the body. This long shadow is what defines the pattern—it shows price rejection.
Fourth, minimal lower wick.
A long lower tail suggests buying support, weakening your signal. Pure selling dominance is what you want.
Fifth, location matters.
A pattern near resistance (previous highs, supply zones, or psychological levels) carries more weight than one appearing randomly on the chart.
Shooting Star vs. Other Similar Patterns
| Pattern | Appears After | Signals | Key Difference |
| Shooting star | Uptrend | Bearish reversal | Sellers reject higher prices |
| Inverted hammer | Downtrend | Bullish reversal | Buyers begin rejecting lower prices |
| Hanging man | Uptrend | Bearish reversal | Has long lower wick instead of upper |
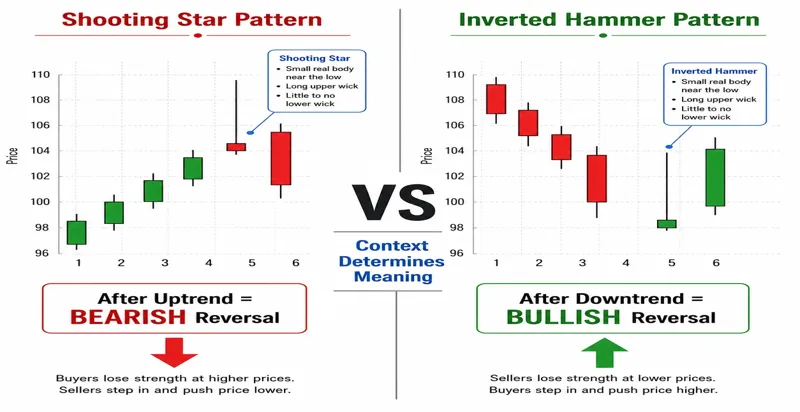
Context is everything. A shooting star after an uptrend signals a bearish move. An inverted hammer after a downtrend signals a bullish move. Confusing these two is how traders make costly mistakes.
The Psychology Behind the Pattern
When a stock shoots higher, there’s optimism. Buyers are excited, piling in, prices soaring. Then momentum shifts either hitting resistance or naturally slowing.
Sellers see an opportunity. They start hitting bids, taking profits, or shorting. Longs who entered late suddenly get scared and exit their positions. This selling wave forces prices down before close.
The resulting small body shows that despite bullish activity earlier, sellers took final control. What you see on the chart is a psychological battle frozen in time on one candle.
How to Trade the Shooting Star Pattern?
Step 1: Wait for confirmation.
The next candle must close below the shooting star’s low. This is non-negotiable. Without confirmation, you’re guessing, not trading signals.
Step 2: Check additional confluence.
Does volume spike? Is RSI above 70 (overbought)? Is the pattern near resistance? Each adds probability to your setup.
Step 3: Enter your position.
Once confirmation appears, short the stock. Enter when that confirmation candle closes or on a break below its low.
Step 4: Set stop-loss above the upper wick.
This defines maximum risk. If price breaks above this level, the reversal signal failed, and you exit immediately.
Step 5: Set profit target.
Measure the pattern’s height (low to high), then project that distance downward 2-3 times from entry. Alternatively, use the nearest support level below.
Real Example: Applying the Rules
Stock XYZ trends upward for 6 days on a daily chart. Price approaches previous resistance at $180. RSI reads 73 (overbought).
Day 7: Opens at $178, rises to $182 (creating long upper wick), closes at $177.50 (small body). Your shooting star forms at resistance with above-average volume. Pattern is valid.
Day 8: Opens at $177, closes at $175.50—below the shooting star’s low. Confirmation achieved.
Entry: Short at $175.50. Stop-loss: $182.10 (above the high). Measurement: $4 ($182-$178). Target: $175.50 – (2 × $4) = $167.50 (2:1 measured move).
Price declines to target over 8 trading days. Result: $8 profit per share on $6.60 risk = 1.21:1 reward-to-risk ratio.
Note: Not all trades hit targets. This example shows a successful setup, not a guarantee.
When NOT to Trade the Shooting Star?
Even strong patterns fail in certain conditions:
- Sideways/choppy markets. The pattern loses reliability without clear uptrend context. Skip trades in consolidation zones.
- Low volume. A shooting star on low volume lacks seller participation. Volume spike on pattern or confirmation is essential.
- Near earnings/major news. Market chaos breaks normal patterns. Stick to calm, normal market conditions.
- Very strong uptrends. Occasionally, intense buying pressure absorbs the pattern and price continues higher. Wait for clear weakness before shorting.
- Without confirmation. This is the #1 reason traders lose money. Never trade the pattern alone.
Common Mistakes That Cost Money
- Trading without confirmation. Entering on the shooting star alone produces high failure rates. That confirmation candle separates signals from noise.
- Ignoring the uptrend requirement. A shooting star in a downtrend or sideways market is meaningless. You need genuine bullish momentum to reverse.
- Overlooking volume. Low volume makes the pattern unreliable. Real selling pressure shows up as volume increases.
- Wrong risk management. Trading without stops or using stops that are too tight/loose destroys accounts. Define your risk before entering.
Important Disclaimer
Trading candlestick patterns involves significant risk. Past performance doesn’t guarantee future results. This content is educational only and not financial advice. Always conduct your own research, understand your risk tolerance, and consult a financial advisor before trading. The shooting star pattern works probabilistically—some trades win, others lose. Use proper risk management (position sizing, stops, and diversification) in all trading activity.
Key Takeaways
The shooting star candlestick pattern is one of the clearest reversal signals available to traders but only when you follow the rules. Spot the pattern, wait for confirmation, manage your risk, and let probability work in your favor over many trades.
Most traders fail because they skip the confirmation step or trade in wrong market conditions. Don’t be that trader. Follow the framework, stick to your stops, and treat each trade as part of a larger system rather than a one-off bet.
Frequently Asked Questions
Bearish, it signals potential downward reversal after an uptrend.
Price often falls (but not guaranteed). Strong uptrends sometimes absorb the pattern and continue higher.
Research on candlestick patterns shows mixed results depending on market conditions and confirmation. Always use additional confirmation signals (volume, indicators, price structure) rather than relying on the pattern alone.
Daily and weekly charts are most reliable. Intraday (1-4 hour) charts have higher false-signal rates. Avoid charts shorter than 1 hour.
Shooting star has a long upper wick (forms in uptrends, bearish). Hanging man has a long lower wick (forms in downtrends, bullish).