
No products in the cart.

An option chain is a table that lists every available call and put option for a stock or index. It organizes them by strike price and expiry date. In short, it’s the single screen where you see price, demand, and market sentiment for every possible options trade at once. So if you understand what an option is but freeze up the first time you open a live option chain, this guide walks through exactly what every column means and how to actually use it.
What is an Option Chain in the Stock Market?
An option chain (also called an option matrix) is a real-time table that displays all active call and put options for a given underlying — a stock or an index — across every available strike price, for a chosen expiry date. Calls sit on one side, puts on the other, with the strike price running down the center.
Every major broker (Zerodha, Upstox, Angel One) and the NSE’s own website provide a live option chain for free — no subscription needed to view it.
What is Open Interest (OI) in an Option Chain?
Open Interest, or OI, is the total number of option contracts currently open at a given strike — meaning traders have bought or sold them but haven’t squared them off yet. Traders watch OI closely because it reflects real committed positions, not just activity.
Here’s how to read the pattern:
- Rising OI with rising price → fresh buying interest
- Rising OI with falling price → fresh selling interest
- Falling OI → traders are closing out existing positions
What is IV in an Option Chain?
IV, or Implied Volatility, reflects how much price movement the market is currently pricing into an option. Higher IV makes an option more expensive relative to its intrinsic value, and IV typically spikes ahead of known events — results season, RBI policy days, Union Budget announcements — then falls sharply once the event passes (a pattern known as IV crush).
What is LTP in an Option Chain?
LTP stands for Last Traded Price. It’s simply the price at which that specific option last changed hands. You’ll see it displayed alongside the bid, what buyers are offering, and the ask, what sellers want. Watch the gap between them: a wide bid-ask spread usually signals low liquidity at that strike, so beginners should avoid trading there.
How to Read Option Chain Data: The Full Column Breakdown
| Column | What it tells you |
|---|---|
| Strike Price | The fixed price at which the option can be exercised |
| LTP | Last traded price of that option |
| Bid / Ask | What buyers and sellers are currently offering |
| OI | Total open contracts at that strike |
| OI Change | How OI moved since the previous session |
| IV | Market’s expectation of future volatility, priced in |
| Volume | Number of contracts traded today at that strike |
What is Option Chain in Stock Market With Example
Say Nifty is trading at 24,500. On the option chain, you’d see the 24,500 strike sitting at the center — this is the At The Money (ATM) strike. Strikes above 24,500 are Out of The Money (OTM) for calls but In The Money (ITM) for puts, and it works the other way below.
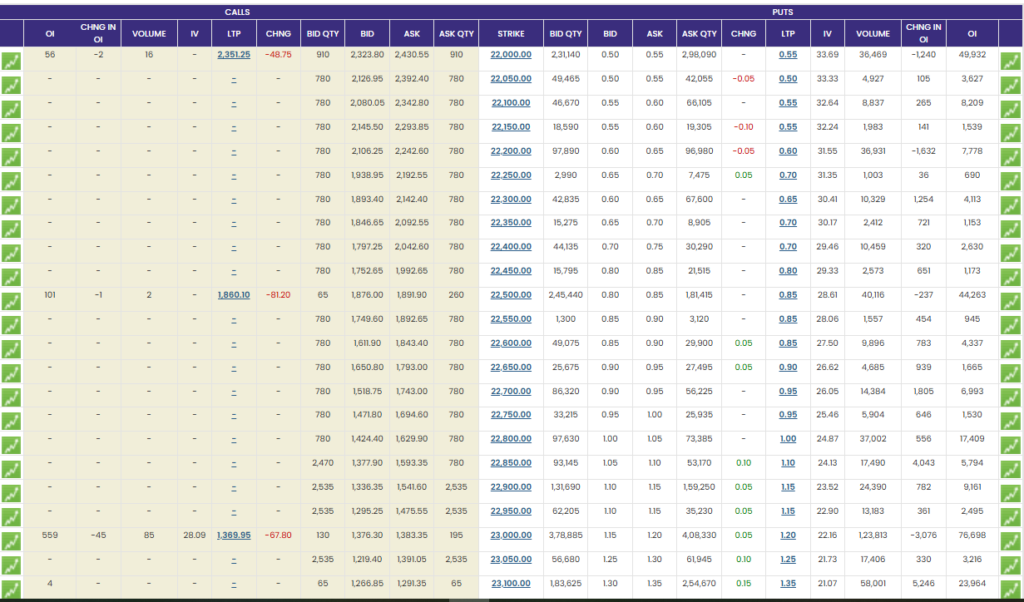
Now watch what the OI tells you. If the 24,600 call strike shows the highest Call OI on the chain, traders read that as a likely resistance zone — a level the market may struggle to break above. Similarly, if the 24,400 put strike shows the highest Put OI, that’s read as a likely support zone. Keep in mind, though, that this isn’t a guaranteed prediction. It’s simply a crowd-positioning signal.
How to Analyse Option Chain Data for Sentiment?
Beyond individual columns, traders use the option chain as a whole to gauge broader market sentiment. One key metric is the Put-Call Ratio (PCR) — you calculate it by dividing total put OI by total call OI. Generally, a PCR above 1 signals bullish sentiment, since more puts are being written, while a PCR below 1 leans bearish. Like OI-based support and resistance, though, PCR works best as a sentiment gauge rather than a certainty.
Common Mistakes Beginners Make Reading an Option Chain
- Chasing deep OTM strikes because the premium looks cheap, without checking how large a move is actually needed
- Reading OI in isolation, without checking OI change
- Confusing high volume with high liquidity
- Ignoring the bid-ask spread and getting a poor fill on an illiquid strike
Key Takeaways
- An option chain shows every call and put for a stock or index by strike and expiry. Your single view of price, demand, and sentiment.
- OI (Open Interest) and IV (Implied Volatility) are the two numbers that matter most. OI shows real committed positions, IV shows how much movement the market is pricing in.
- Heavy Call OI often signals resistance, heavy Put OI often signals support — a sentiment cue, not a guarantee.
- Avoid strikes with a wide bid-ask spread, and never read OI or volume in isolation. It always check the change alongside it.
For the fuller list, see our guide on common mistakes in F&O trading.
Where to Go Next
Once these basics feel familiar, the natural next step is understanding Options Greeks – Delta, Theta, Vega to judge how an option’s price actually behaves as market conditions change.
If you’d rather learn this hands-on with live market practice instead of piecing it together from guides, our options trading course in Jaipur covers option chain reading, Greeks, and strategy building under one structured curriculum.
Frequently Asked Questions
An option chain is a table listing every call and put option available for a stock or index, organized by strike price and expiry date, showing price, open interest, and volume data for each.
OI stands for Open Interest — the total number of option contracts currently open at a given strike, used to gauge how much real capital is committed to that position.
IV stands for Implied Volatility — a measure of how much price movement the market expects for that option before expiry, which directly affects the option’s premium.
Start at the center strike (ATM), compare call OI and put OI on either side to spot potential resistance and support zones, and check IV and volume before entering any specific strike.
Not always — it’s a sentiment signal based on current positioning, not a guarantee. Price can and does break through high-OI strikes.