No products in the cart.
Disclaimer: This article is for educational purposes only and does not constitute investment advice. Trading in equities, derivatives, or forex involves significant risk. Past chart patterns do not guarantee future performance. Please consult a SEBI-registered investment advisor before making trading decisions.
Quick Definition
A doji candlestick pattern forms when a security’s opening and closing prices are nearly identical leaving a tiny or nonexistent real body with wicks extending on both sides. On the chart, it resembles a cross or plus sign. It signals that neither buyers nor sellers gained control during that session, a state of market indecision that often precedes a trend reversal.
Most traders have spotted a doji on their chart and either ignored it or entered a trade too soon. Both approaches are costly. Once you understand what’s happening behind that small candle and what context it needs to carry weight it becomes one of the more reliable signals available in technical analysis.
Doji Candlestick Pattern at a Glance
| Attribute | Details |
| Pattern type | Neutral indecision / Reversal warning |
| Best used with | Trend direction, support/resistance, volume, RSI, MACD |
| Confirmation needed? | Yes — always wait for the next candle |
| Best timeframe | Daily and weekly charts (minimum 15-min for intraday) |
| Works in | Stocks, forex, commodities, crypto |
| Risk level | Medium — high if traded without confirmation |
| Indian market examples | Nifty 50, Bank Nifty, Reliance, HDFC Bank, Tata Motors |
What Is a Doji Candle?
A doji candle forms when a session’s open and close prices are nearly identical, producing a flat or near-flat real body with wicks above and below. It represents a complete standoff between buyers and sellers, signalling that the prevailing trend may be losing momentum. However, alone it is not a trade signal; instead, it is an early warning to watch closely for what follows.
This pattern develops when buyers and sellers contest an entire session and finish almost exactly where they started. Price may have moved significantly in both directions, but by the close it returns to the open.
In other words, that standoff is the doji candle meaning in practice — indecision. Neither side has the conviction to move price and sustain it.
Structure of a Doji Candlestick Pattern
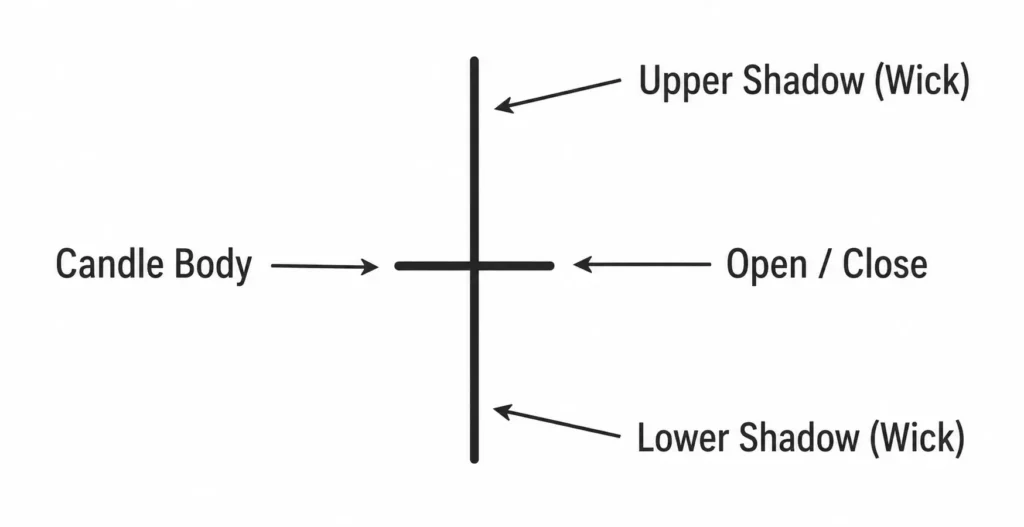
Every doji has three components: a flat or near-flat real body where open and close meet, an upper shadow showing the session’s high, and a lower shadow marking the low. The real body itself can be thinner than a single horizontal line.
However, what changes across doji types is the length and proportion of those wicks. That difference signals who was more aggressive and who ultimately conceded ground.
What Does a Doji Tell Traders?
Importantly, a doji does not produce a direct buy or sell signal. What it communicates is that momentum is stalling and a turning point may be approaching. Think of it as a caution signal on the chart, the market has not committed to a direction, but attention is warranted for the next move.
Indian market context: In Nifty 50 and Bank Nifty, doji patterns on the daily chart near major support or resistance zones (such as round-number levels like 22,000 or 47,000 on Bank Nifty) have historically preceded notable reversals, particularly when accompanied by above-average delivery volume in cash market sessions.
5 Types of Doji Candlestick Patterns
The five types of doji are: Standard (neutral, equal wicks), Long-Legged (extended wicks both sides, high volatility), Dragonfly (long lower wick, bullish at support), Gravestone (long upper wick, bearish at resistance), and Doji Star (gaps away from prior candle, strongest reversal signal). Each shape tells a different story about who controlled the session.
Identifying a doji on the chart is only the starting point. The shape of the wicks determines whether you are looking at mild hesitation or a high-conviction reversal setup. Here are the five types visible on live charts.
1. Standard (Neutral) Doji
Equal upper and lower wicks, near-flat body, a balanced standoff with no directional lean. The weakest signal of the five; most common in sideways markets.
2. Long-Legged Doji
Dramatically extended wicks on both sides, price swung hard in both directions but closed near the open. Signals extreme volatility-backed indecision; direction only confirms with the next candle.
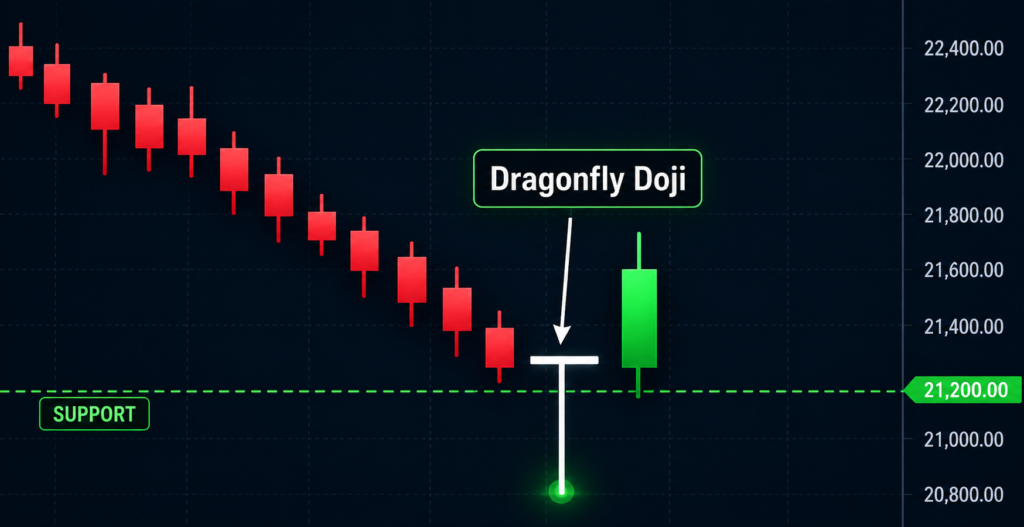
3. Dragonfly Doji
Long lower shadow, no upper wick — sellers pushed hard but buyers drove price all the way back to the open. A bullish reversal signal, most reliable at the bottom of a downtrend sitting on support.
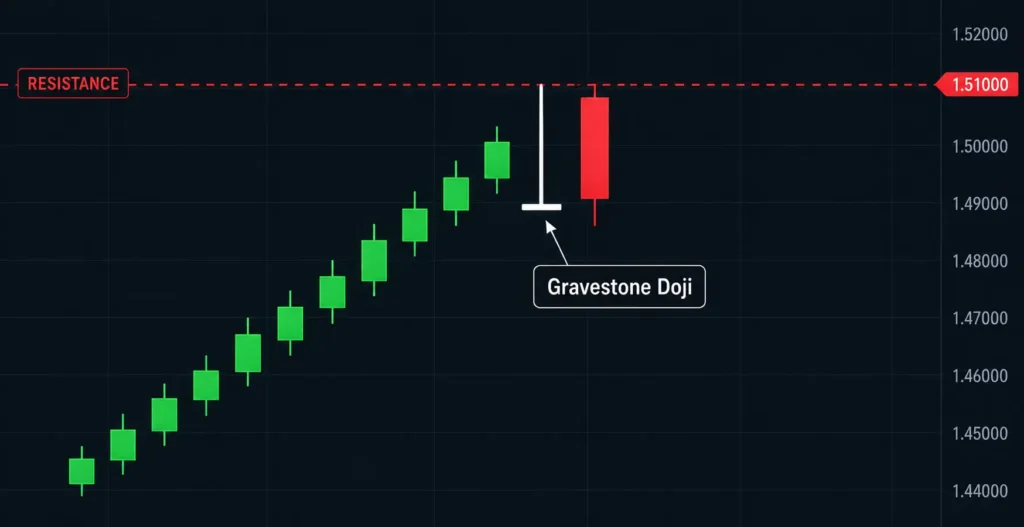
4. Gravestone Doji
Long upper shadow, no lower wick — buyers pushed price high but sellers erased all gains. A bearish reversal signal; warrants caution when it appears at the top of an uptrend near resistance.
5. Doji Star
A doji that gaps away from the previous candle. Signal strength is highest when it forms as part of a Morning Star (after a downtrend) or Evening Star (after an uptrend) multi-candle setup.
| Doji Type | Shape | Signal | Best Context |
| Standard | Equal wicks, flat body | Neutral indecision | Range-bound market |
| Long-Legged | Very long wicks, both sides | High volatility, no bias | Pre-breakout zonesPre-breakout zones |
| Dragonfly | Long lower wick, no upper | Bullish reversal | Bottom of a downtrend |
| Gravestone | Long upper wick, no lower | Bearish reversal | Top of an uptrend |
| Doji Star | Gaps away from prior candle | Strong reversal signal | After extended trends |
Is a Doji Bullish or Bearish?
A doji is neither bullish nor bearish by itself. It signals indecision. However, a doji becomes a bullish doji candle when it appears after a downtrend near support and the next candle closes above the doji’s high. Conversely, it becomes a bearish doji candle when it appears after an uptrend near resistance and the next candle closes below the doji’s low. Therefore, trend context determines the interpretation.
Doji in an Uptrend vs. a Downtrend
For example, a doji appearing after a sustained uptrend signals that buying momentum is fading. Sellers are now matching buyers and a bearish reversal could be building. Conversely, the same doji after a prolonged downtrend signals the opposite: selling pressure is exhausting itself and buyers are stepping in. The candle is identical; the interpretation is opposite because the surrounding trend context differs entirely.
The Role of Support and Resistance Levels
Furthermore, a doji forming at a key support or resistance level carries substantially more weight than one appearing mid-range with no reference point. A dragonfly doji bouncing off long-term support on Nifty 50 or Bank Nifty is a materially different setup from a random dragonfly mid-chart. Location does not create the pattern, but it determines how seriously the signal should be weighted.
Doji vs. Similar Patterns: Key Differences
However, the doji is frequently confused with the spinning top, hammer, and shooting star. The core distinction is body size and wick proportion. A doji’s open and close are nearly identical; similar-looking patterns have a visible real body. These differences change the signal strength and directional bias significantly.
Doji vs. Spinning Top
Both signal indecision, but the distinction matters for signal strength.
| Doji | Spinning Top |
| Open and close nearly identical | Open and close visibly differ |
| Real body is flat or a thin line | Small but discernible real body |
| Stronger indecision signal | Weaker indecision signal |
| Rarer and therefore more notable | More common in choppy markets |
A doji signals more extreme indecision than a spinning top and is the more actionable of the two.
Dragonfly Doji vs. Hammer
| Dragonfly Doji | Hammer |
| Open and close are at or near the high | Small but visible real body at the top |
| No real body — buyers fully recovered losses | Long lower wick with slight close below open |
| Stronger bullish reversal signal | Solid bullish reversal signal |
| Requires next-candle confirmation | Also requires confirmation to act on |
Both are bullish reversal signals at support; the dragonfly doji is stronger because buyers recovered 100% of session losses.
Gravestone Doji vs. Shooting Star / Inverted Hammer
| Gravestone Doji | Shooting Star |
| Open and close at or near the low | Small real body near the low with a long upper wick |
| No real body — sellers fully erased gains | Bearish signal at resistance after an uptrend |
| Stronger bearish reversal signal at resistance | Slightly weaker than a gravestone doji |
How to Confirm a Doji Signal Before Trading?
Most importantly, never act on the doji candle itself. Wait for the next candle to confirm direction. For a bullish setup, the next candle must close above the doji’s high. For a bearish setup, it must close below the doji’s low. Add volume and at least one momentum indicator — RSI or MACD — to reduce false signals before entering.
The Next-Candle Confirmation Rule
For a bullish setup, wait for the next candle to close above the doji’s high. Conversely, a bearish setup requires the next candle to close below the doji’s low. No confirmation close means no trade, not a reduced position, not a test entry.
Pairing Doji with Volume and Indicators
A doji on high volume carries weight; one on thin volume is noise. Add RSI for overbought/oversold conditions, MACD crossovers for momentum shifts, and Bollinger Bands for squeeze setups.
⚡ Confirmation tip: When the confirmation candle is unusually large — such as a full bullish or bearish engulfing — that strengthens the signal beyond a modest confirmation candle. Both volume and candle body size count toward signal quality.
Doji Trading Checklist — Before You Enter
- Clear trend preceding the doji (up or downtrend, not sideways)
- Doji forming at or near a key support or resistance level
- Volume on the doji candle is above the 20-day average
- RSI shows overbought (>70) for bearish setups or oversold (<30) for bullish
- Next candle has confirmed direction (closed above high or below low)
- Stop-loss level defined before entry
- Minimum 1:2 risk-reward ratio confirmed
How to Trade the Doji Candlestick Pattern
Once confirmation is received, enter at the open of the next candle. Place a stop-loss just below the doji’s low for bullish trades, or just above the doji’s high for bearish trades. Target the nearest significant support or resistance level with a minimum 1:2 risk-reward ratio. Use daily or weekly charts for highest reliability.
Entry Point
Enter at the open of the candle following the confirmation candle’s close — above the doji’s high for bullish, below for bearish. Never chase a confirmation candle mid-session; wait for the close.
Example (illustrative): If a dragonfly doji forms on the Nifty 50 daily chart at a prior support level of 21,800, and the next day’s candle closes above the doji’s high, a trader might enter a long position at the open of the third candle with a stop-loss just below 21,800 and an initial target at the next resistance zone around 22,400.
Stop-Loss Placement
For bullish trades, place the stop just below the doji’s low. For bearish trades, position the stop just above the doji’s high. If price reclaims the full doji range, the pattern has failed — exit before a misread becomes a large loss.
Profit Target
Target the nearest significant support or resistance level. Minimum 1:2 risk-reward ratio — risk ₹1 to make ₹2. Don’t hold for extreme targets on a single doji signal.
Best Timeframe for Doji Patterns
Generally, daily and weekly charts give the most reliable signals — each candle reflects broad market consensus. For intraday trading, use 15-minute charts at a minimum; on lower timeframes dojis appear constantly and most are meaningless.
Limitations of the Doji Candlestick Pattern
Common Mistakes When Trading Doji Candles
- Entering without confirmation. A doji signals indecision — not a trade. Taking a position before the next candle confirms direction is how traders get caught on the wrong side of a breakout. Wait. Always.
- Ignoring trend context. A doji in the middle of a consolidation range carries almost no weight. The pattern’s power comes from appearing at the end of a clear, extended trend. Without that setup, there’s no reversal to trade.
- Using the doji in isolation. Volume, RSI, MACD, support and resistance — these aren’t optional extras when trading a doji. They’re what separate a real setup from a random shape on the chart.
- Over-trading intraday dojis. On sub-15-minute charts, doji candles appear constantly and most are meaningless — acting on each one drives up transaction costs with inconsistent results.
Key Takeaways
Overall, the doji candlestick pattern is one of technical analysis’s most recognisable signals and also one of the most misread. It doesn’t tell you what the market will do. It tells you the market hasn’t decided yet.
Used correctly with clear trend context, a meaningful price level nearby, volume confirmation, and indicator backup, it’s a reliable early warning that a reversal may be forming. Used alone, it’s just a cross on your chart.
Three non-negotiables: always wait for next-candle confirmation, always check the trend context, and always stack at least two additional signals before entering a trade.
→ Go deeper: See how the doji combines with the Engulfing Pattern and Hammer Candlestick for the highest-probability reversal setups.
Also Read: Shooting Star Candlestick Pattern: How to Identify and Trade It
Frequently Asked Questions
A doji candlestick indicates that buyers and sellers ended the session in near-perfect balance — neither side gained control. It signals that the current trend may be losing momentum and a reversal could follow, particularly when it forms near key support or resistance with above-average volume.
Yes. Doji patterns appear across stocks, forex, crypto, and commodities. They are most meaningful in liquid markets that is Nifty 50, Bank Nifty, major forex pairs like USD/INR where the price action reflects actual institutional participation rather than thin-volume noise.
Two consecutive doji candles signal extended indecision and actually strengthen the reversal case. The market is taking longer to pick a direction, which often means a more decisive move is building underneath the surface. The longer the standoff, the sharper the eventual breakout tends to be.
Look for a candle where the open and close prices are nearly identical, creating a very thin or flat real body. The wicks can vary in length. The shape resembles a cross, plus sign, or inverted cross depending on the doji type. On most charting platforms like Kite by Zerodha, TradingView, or NSE ChartIQ — you can scan for doji formations using built-in pattern recognition tools.
Primarily a reversal signal. But a doji forming inside a consolidation zone mid-trend, with no clear exhaustion on either side can indicate continuation: the market pausing before the prior trend resumes. Context and location on the chart determine which reading applies.